
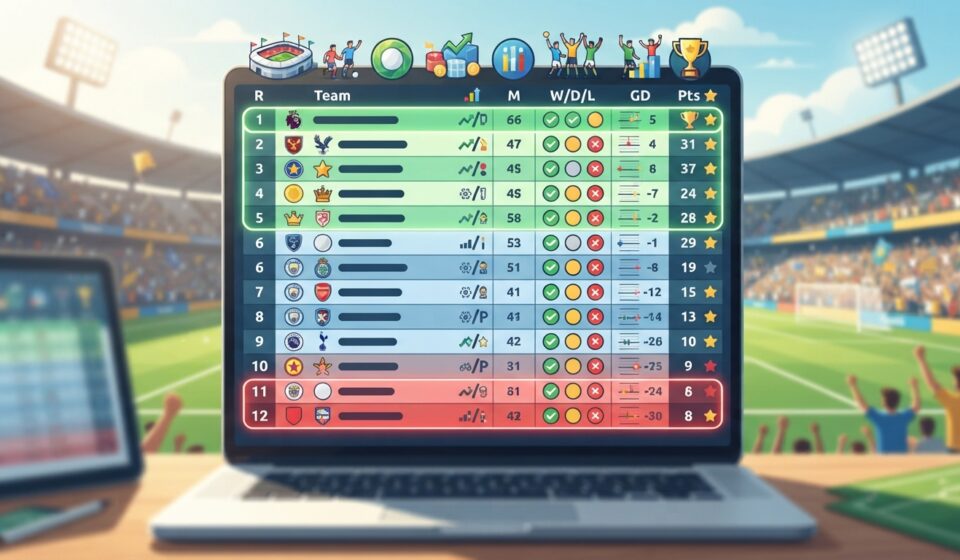

Football statistics are everywhere: on broadcast graphics, in match reports and on score pages. Yet numbers on their own can be misleading if you do not know what they measure.
This guide explains the most common football statistics and how to use them without drawing the wrong conclusions.
Why football statistics are useful
The scoreline tells you who won, but not always how. Statistics add detail by showing how the game unfolded, which team created chances and where a side struggled.
Used carefully, they help fans discuss matches more thoughtfully and spot trends across a season.
Possession: helpful, but not the whole story
Possession shows how much of the match each team had the ball. A high number can suggest control, but it does not guarantee a result.
Some teams prefer to sit deep and strike on the counter, so they may win with a low possession figure. When you read this number, pair it with chances created to see whether the ball was used well.
Shots and shots on target
Shots show how often a team tried to score. Shots on target count the ones that forced a save or went in.
A team with many shots but few on target may be forcing efforts from poor positions. A team with fewer shots but more on target may be more efficient. Quality matters as much as quantity.
Corners, fouls and cards
These numbers add a sense of the match’s character:
- Corners: can reflect sustained pressure, though not always dangerous pressure
- Fouls: may show a physical or interrupted game
- Yellow and red cards: point to discipline and can swing a match
On their own, they rarely tell you who played better, but they help explain how the game felt.
Head-to-head records
Head-to-head statistics show how two teams have performed against each other in the past. They are interesting before a big fixture, especially in derbies and cup ties.
Still, remember that squads, managers and form change. A record from several years ago may say little about the next meeting, so treat it as background rather than a forecast.
When you want to check recent results, tables and match details in one place, you can browse a site like NOBARID and compare the numbers with what you saw on the pitch.
Advanced metrics in plain words
You may also see terms such as expected goals, often shortened to xG. This measure estimates how likely a shot was to become a goal based on factors like distance and angle.
Over many matches, xG can show whether a team is creating good chances or simply getting lucky. It is a helpful extra, but it works best when combined with what you watch.
How to avoid misreading numbers
- Do not rely on one statistic alone.
- Compare numbers with the final result and the flow of the match.
- Look at trends across several games, not just one.
- Remember that context, such as red cards or injuries, changes the picture.
Statistics are a tool for understanding, not a replacement for watching the game.
FAQ
Which football statistic is the most important? There is no single answer. Shots on target and chances created usually tell you more than possession alone.
What does xG mean? xG stands for expected goals, an estimate of how likely a shot was to be scored.
Are statistics reliable? Most basic numbers are accurate, but some measures involve judgement, so figures can vary slightly between providers.
Conclusion
Football statistics add depth to the game when used wisely. Learn what each number measures, compare it with what you saw, and look for patterns over time. That way, every match gives you a little more to enjoy and to talk about.